3D Urban Typologies — Nordic Residential Areas
Characterising built-vegetation heterogeneity from LiDAR to support nature-positive planning
The problem
Urban planning decisions about green infrastructure are typically made using 2D land cover maps — which tell you where trees are but not how tall they are relative to buildings, how dense the canopy is, or how the vertical structure of a neighbourhood shapes the micro-environment experienced by both people and wildlife.
In Nordic cities, where residential areas vary enormously — from low-rise detached housing with garden trees to mid-rise apartment blocks with courtyard vegetation to park-dominated neighbourhoods with mature forest canopy — this 2D view misses the ecologically and planning-relevant variation that actually matters.
This postdoctoral research developed a novel approach to characterise 3D urban heterogeneity from airborne LiDAR — simultaneously capturing building height, vegetation height, and their spatial associations across residential neighbourhoods in Lahti.
Approach
Using LiDAR-derived point clouds processed on HPC infrastructure, I extracted height profiles for both buildings and vegetation at fine spatial resolution across the city.
Tools: Python · R · LiDAR · HPC (Linux) Data: Airborne LiDAR point cloud
Scale: Individual neighbourhood buffers · city-wide coverage
Five urban typologies
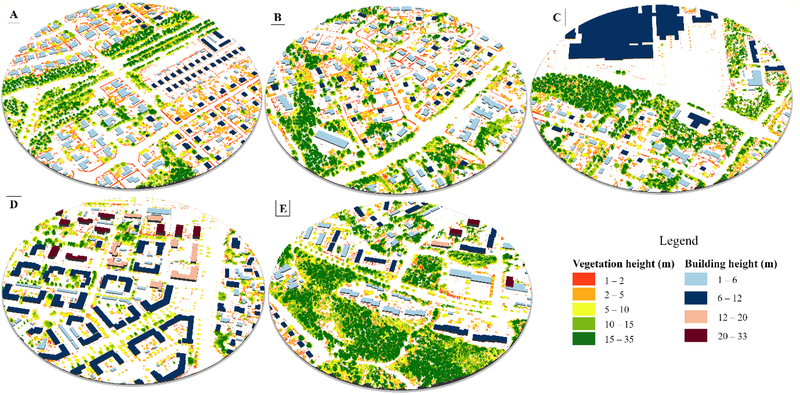
Each circular buffer represents a distinct typology:
| Typology | Character |
|---|---|
| A | Low-rise buildings · layers of vegetation · low interpersion |
| B | Low-rise buildings · layers of vegetation · high interpersion |
| C | Large footprint buildings · forest patches · dominated by built surface |
| D | High-rise blocks · courtyard structure · limited vegetation patches |
| E | High-rise buildings embedded in tall mature forest canopy |
The contrast between typologies A and E illustrates the core finding — neighbourhoods with equivalent building densities can have radically different ecological characters depending on the height and spatial configuration of their vegetation.
Why this matters for planning
These typologies are not just descriptive — they are planning tools. By mapping which typology each neighbourhood belongs to, city planners can:
- Identify where nature-based solutions interventions would have the greatest impact (typology C and D areas with low green structure)
- Set evidence-based targets for green infrastructure investments in new developments, referenced against the typology spectrum
The typologies were synthesised to test and support biodiversity-sensitive planning in Nordic residential areas —