Urban Heat Island — Chandigarh and Satellite Towns
Smaller cities, worse heat islands — evidence from India’s first planned city and five satellite towns
The counter-intuitive finding
Conventional wisdom says larger, more urbanised cities have stronger heat islands. This study found the opposite.
Chandigarh — India’s first planned city, its most urbanised centre in this study, with the highest proportion of built-up surface — experienced less surface urban heat island (SUHI) intensity than three of its much smaller satellite towns. Zirakpur, Kharar, and Mullanpur Garibdass, despite being a fraction of Chandigarh’s size, had the worst thermal environments of all six urban centres studied.
The reason: it is not how much built-up area a city has that determines its heat island — it is how that built-up area is spatially distributed relative to green spaces and water.
Study area
Six urban centres in the Chandigarh Capital Region, Punjab/Haryana, India — mapped across four time points: 1992, 2000, 2010, 2019.
| Urban centre | Character |
|---|---|
| Chandigarh | India’s first planned city · highest vegetation ratio (0.75) |
| Panchkula | Second prime centre · adjacent to Shivalik forest ranges |
| Mohali | Largest satellite town · vegetation along river channels |
| Zirakpur | Fast-growing satellite town · lowest vegetation ratio (0.49) |
| Kharar | Small satellite town · 95% built-up area under distinguished SUHI by 2019 |
| Mullanpur Garibdass | Smallest · highest SUHI intensity per unit area |
Tools: Google Earth Engine · R · Landsat 4/5 and 8
Indices: Land Surface Temperature (LST) · Surface Urban Heat Island (SUHI) · Urban Thermal Field Variation Index (UTFVI) - Ecological Quality Indicator
From LST to SUHI to ecological quality
The analysis followed a three-step derivation:
LST (land surface temperature from Landsat thermal bands) → SUHI (relative temperature elevation above rural background, classified into six intensity grades) → UTFVI (Urban Thermal Field Variation Index — ecological quality experienced by residents, from excellent to worst)

Mean LST across the study area rose from 18.4°C to 26.7°C between 1992 and 2019 — a warming of over 8°C in less than three decades, driven almost entirely by agricultural land being converted to built-up surfaces.
SUHI intensity
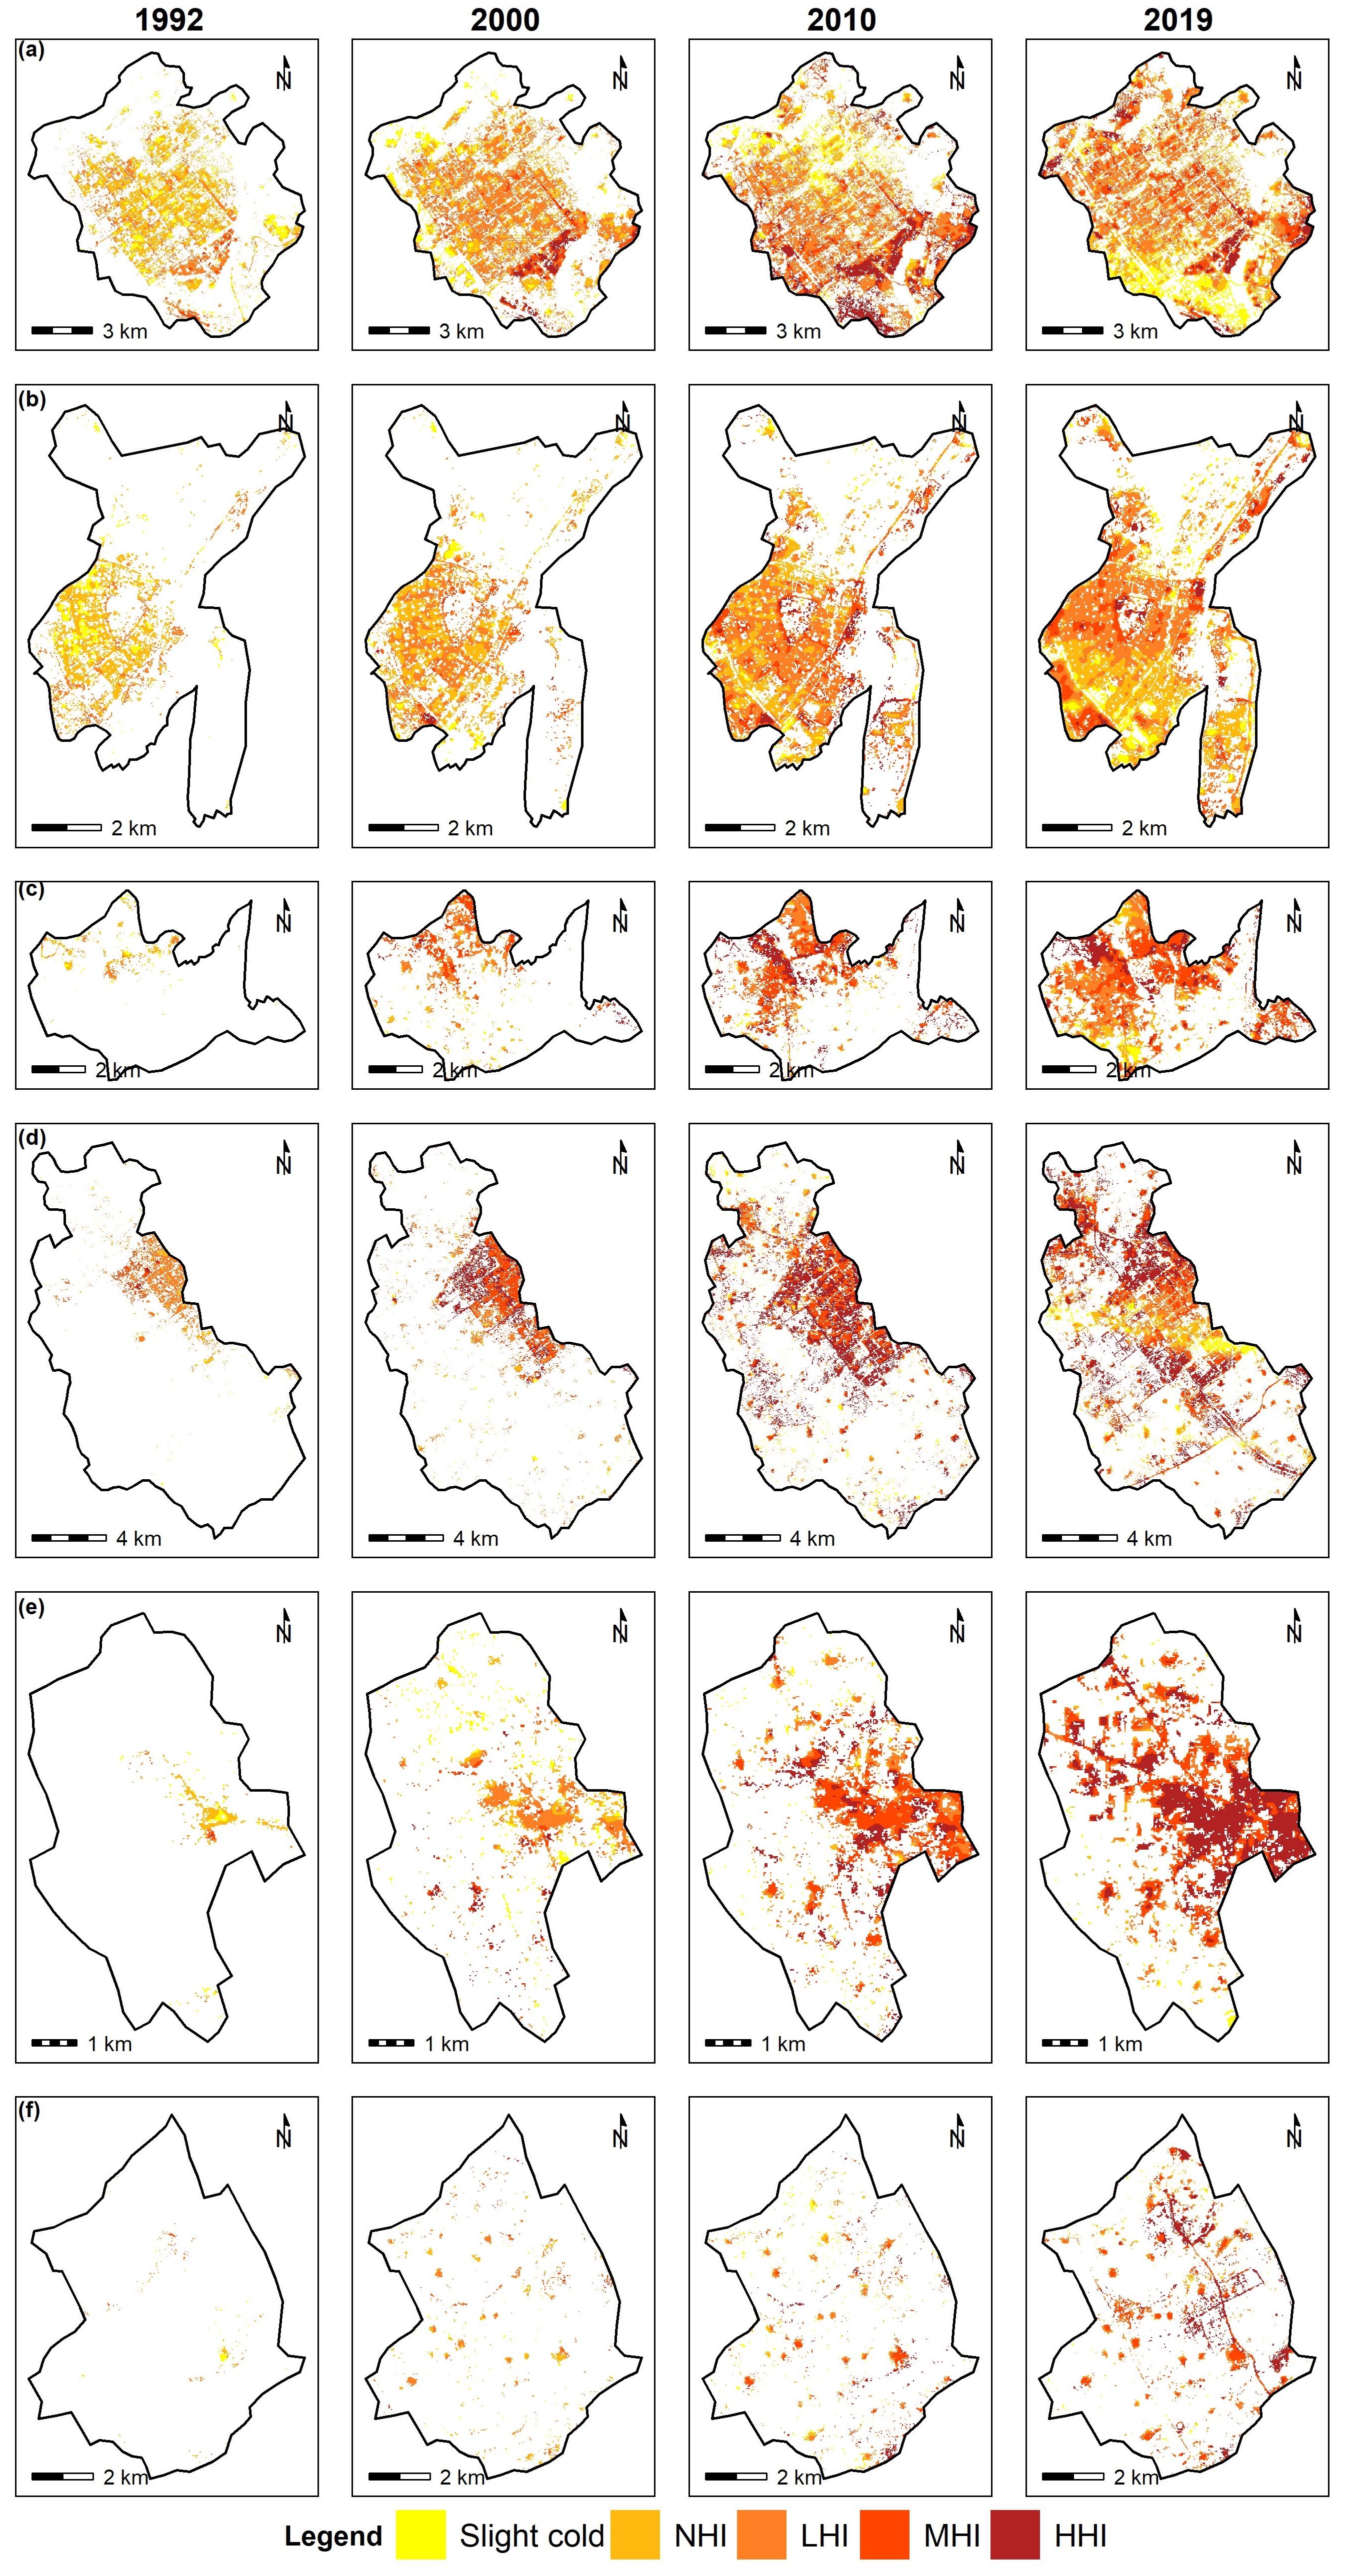
The spatial pattern is striking. Within Chandigarh’s urban boundary, forest cover actually increased by 46% between 1992 and 2019 — a direct result of planned city greening. This, combined with the cooling effect of Sukhna Lake, kept SUHI intensity suppressed despite high urbanisation. Panchkula’s proximity to the Shivalik forest ranges provided a similar geographic cooling buffer.
In contrast, Zirakpur, Kharar, and Mullanpur Garibdass urbanised rapidly with no equivalent greening — producing dense built-up areas with no spatial interspersion of vegetation or water. By 2019, 95% of Kharar’s built-up area was under distinguished SUHI impact.
Ecological quality — UTFVI

Excellent ecological quality zones were found only within Chandigarh, Panchkula, and partially in Mohali. For Zirakpur, Kharar, and Mullanpur Garibdass, excellent quality was restricted to peripheral cropland outside the urban boundary — meaning residents of these towns experienced predominantly poor to worst thermal environments within their own cities.
Key finding and planning implications
The intensity of heat island effects is not a simple function of city size or total built-up area. It is determined by the spatial distribution and pattern of built-up surfaces relative to green spaces and water across the urban landscape.
This has direct implications for satellite town development across India and the Global South — where rapid peri-urbanisation is creating new cities without the green infrastructure frameworks that Chandigarh benefited from at founding.
Practical recommendations from the study:
- Integrate green space and water body targets into satellite town masterplans from the outset — retrofitting is significantly harder
- Prioritise greening in high-SUHI zones identified by the spatial maps
- Develop green belts along road networks and residential areas
- Cool roofs and permeable pavements as immediate interventions in already built-up areas with no room for new vegetation
Note on publication status
This work was completed out of interest during doctoral studies but not submitted for publication. The spatial analysis, maps, and findings represent original research conducted solely by me during my time at Jawaharlal Nehru University.