What could the Western Himalayan landscapes look like by 2040?
Three plausible pathways modelled for Dharamshala and Pithoragarh
The Question
Medium-sized Himalayan towns sit at a crossroads. They are growing fast enough to matter ecologically, but still small enough that planning decisions can meaningfully shape what they look like in twenty years. The question is not whether they will grow. They are and will continue growing tremendously. The question is how, and at what cost to the landscapes they depend on.
To make that question concrete, three plausible futures were modelled for Dharamshala and Pithoragarh up to 2040 — not to predict what will happen, but to show planners and policymakers what each path looks like on the ground before they commit to it.
What Was Done
A CA-Markov simulation framework was calibrated against observed land cover transitions from 2002 to 2021 (see the LULC Change project). Three scenarios were built by modifying the transition probability matrix to reflect different planning and governance assumptions:
| Scenario | Urban growth | Ecosystem protection | Logic |
|---|---|---|---|
| BAU — Business as Usual | Follows historical trend | None | Growth continues unchecked |
| ESP — Ecosystem Protection | 20% less than BAU | Cropland converts to forest; barren land restored | Ecological Conservation priorities in force |
| SED — Socio-economic Development | 20% more than BAU | None | Development-first priorities |
The maps were designed from the outset to be used in stakeholder deliberation — translating model outputs into spatial narratives that planners, municipal authorities, and local communities can engage with directly, not just read as academic results.
Tools: IDRISI/TerrSet · ArcGIS · Data: Calibrated LULC maps 2002–2021 · topographic constraints
Projected LULC 2040
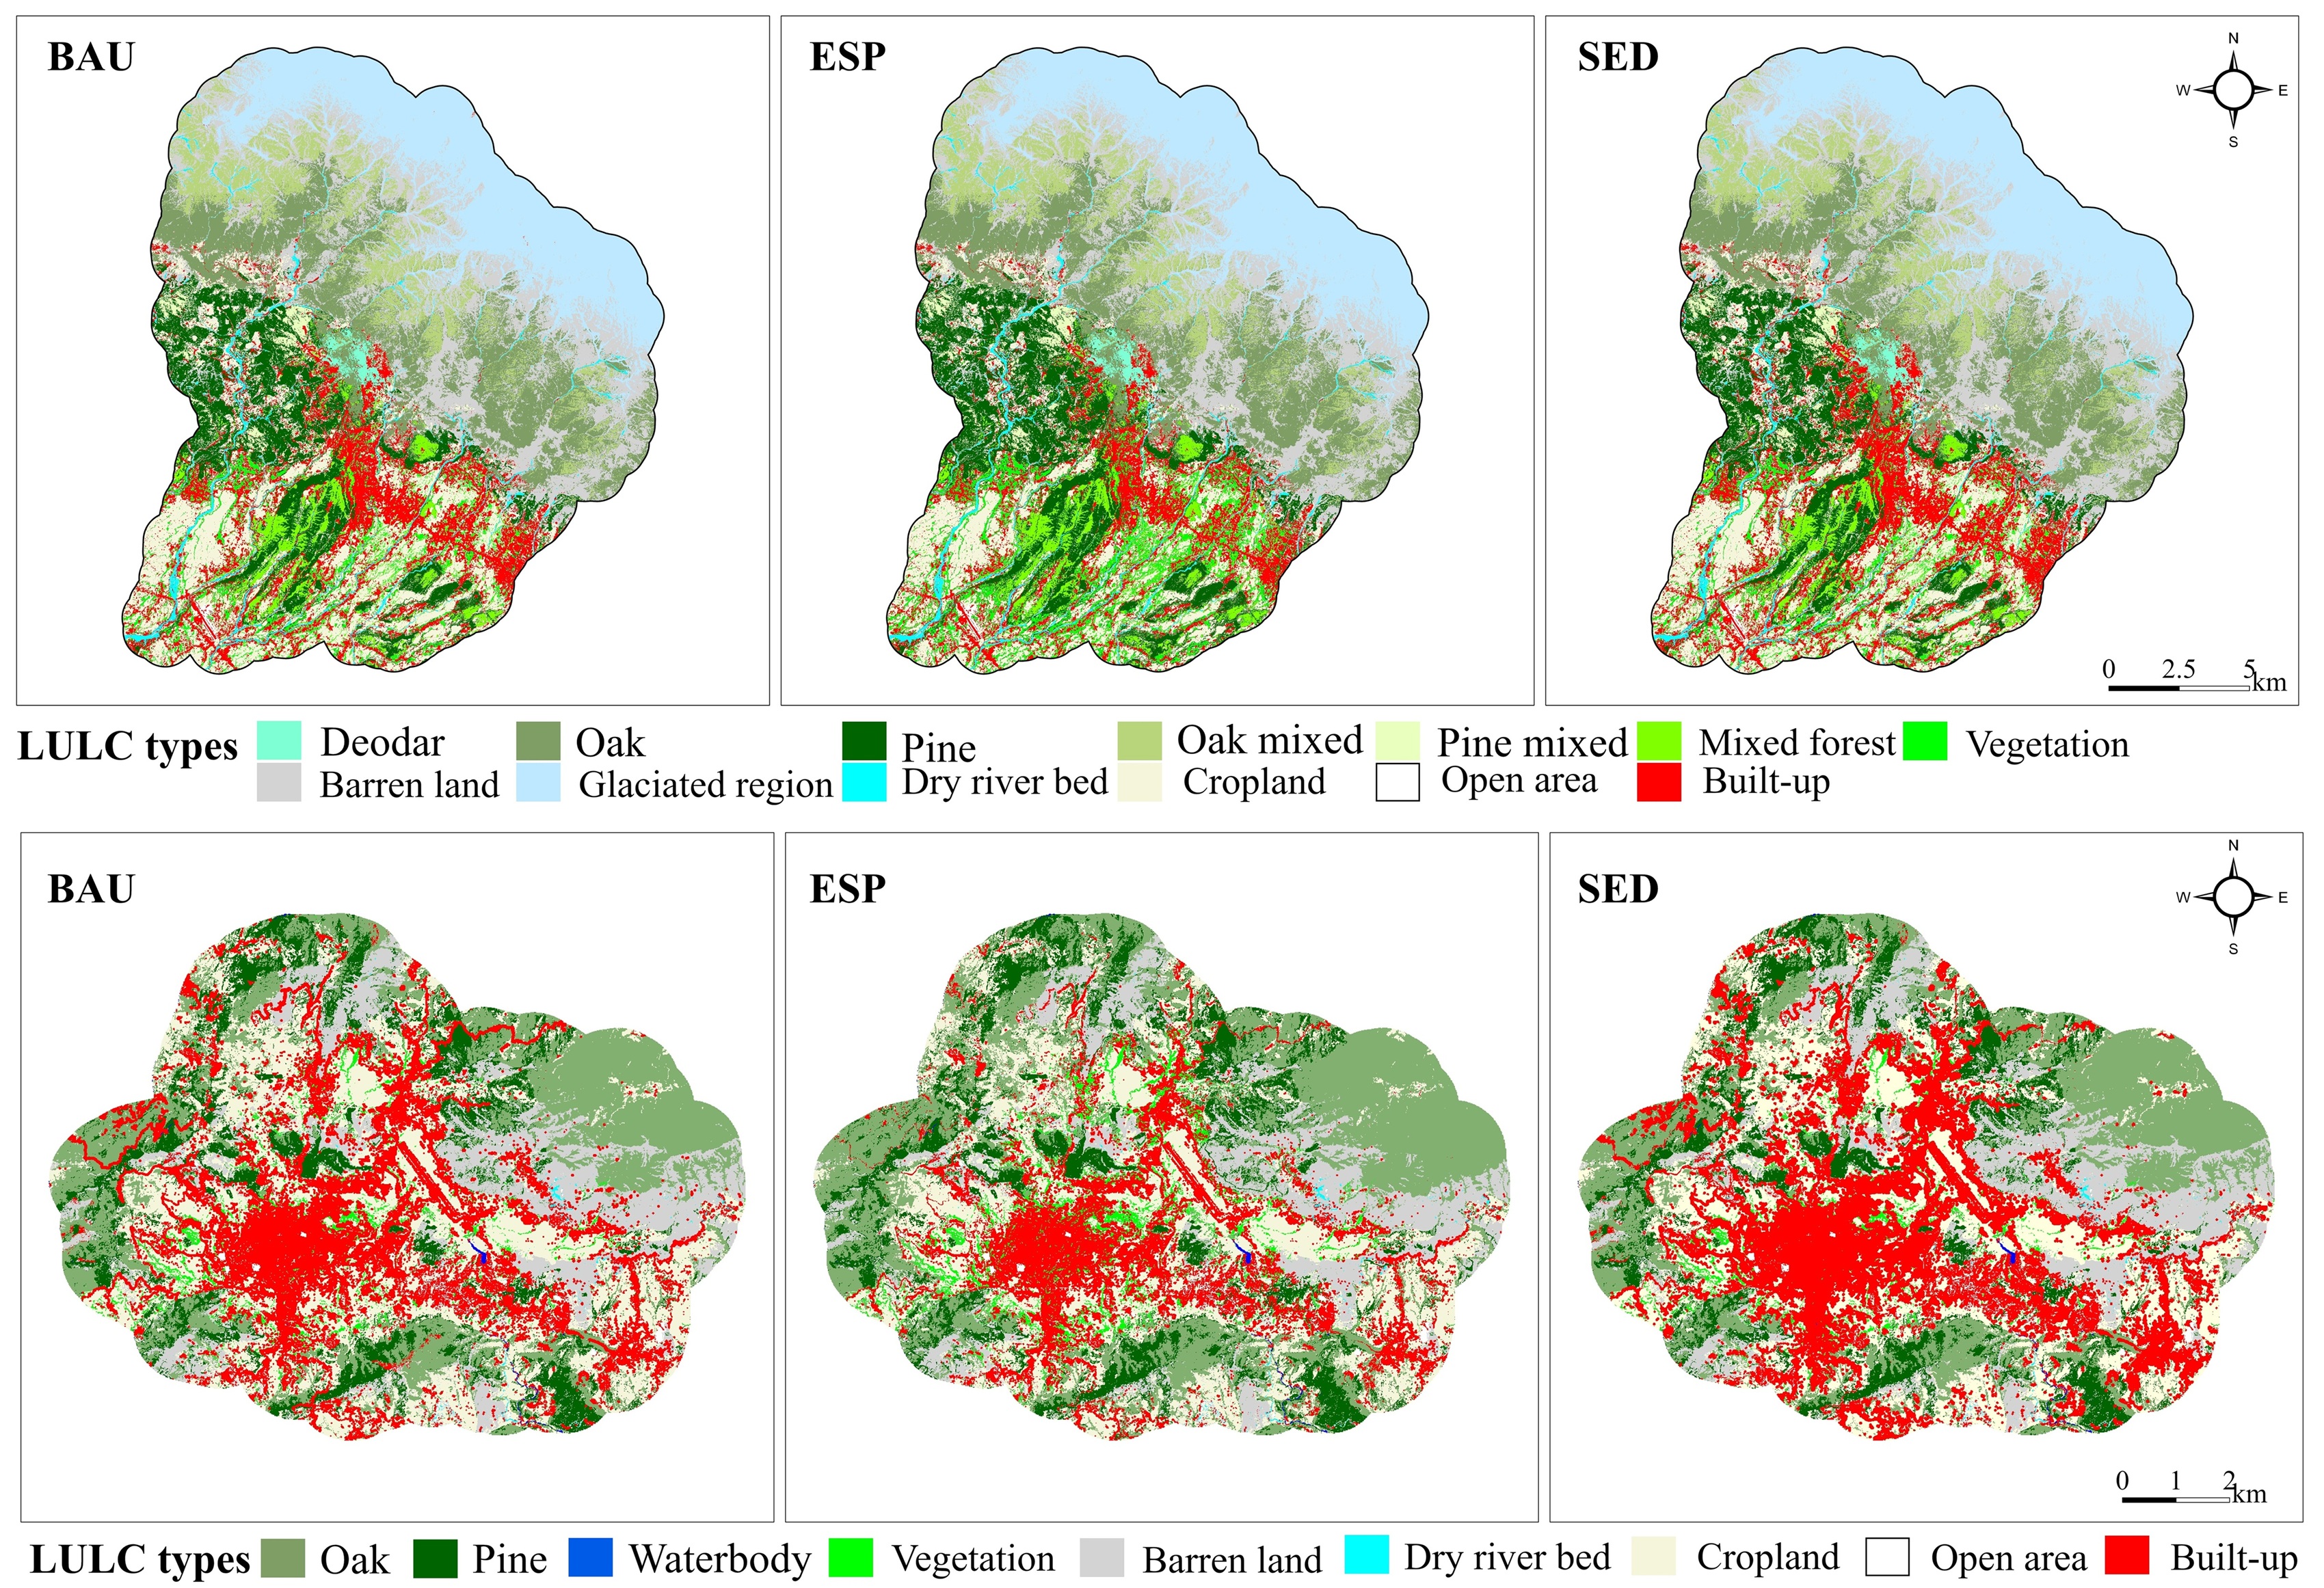
The contrast is visible. Under ESP, forest patches are retained and partially restored. The landscape in 2040 still carries ecological connectivity across slopes. Under SED, red built-up dominates valley floors and spreads onto terrain that was forested in 2021. BAU sits between the two, but still entails substantial and largely irreversible loss.
What Planners Can Do With This
See the cost of inaction before it is too late The BAU scenario is not a neutral baseline. It is a projection of what happens if planning capacity stays where it is today. For Pithoragarh, that means the built-up footprint more than doubles in under twenty years, with vegetation and cropland absorbing the majority of that cost.
Use ESP as a design target, not just a model output The ecosystem protection scenario shows that meaningful reversal is spatially possible. Forest gains of 24–31% are achievable if transition probabilities are actively managed through conservation zoning, reforestation incentives, and constrained infrastructure permitting. These are concrete, implementable policy levers.
Plan by trajectory, not by average The three scenarios diverge most sharply in the outer zones of both cities, where planning authority is weakest and growth pressure is highest. That is exactly where scenario-informed zoning can have the most impact, because land conversion there is not yet irreversible.
Feed scenarios into ecosystem service and climate risk assessments Each trajectory carries a different profile of flood regulation capacity, soil erosion, carbon storage, and local heat regulation. The LULC projections here connect directly to those calculations (see the Ecosystem Services project), giving EIA teams and municipal climate offices a spatially explicit basis for evaluating what each planning path actually costs in ecosystem terms.
Publication
Sharma, S., Joshi, P.K., and Fürst, C. (in progress). Rampant or ecological? Urban growth pathways in Himalaya. Ecological Indicators.